Hi leonidas,
McIDAS-V does not do any extra processing or filtering of "bad" pixels. It should just display the field you selected as-is.
I discussed your post with a colleague. We think what you're seeing is due to the UnderDevelopment>Imagery-JPSS chooser displaying a lower resolution by default. If you request full resolution we think it will match up with the plot you did in Python/numpy.
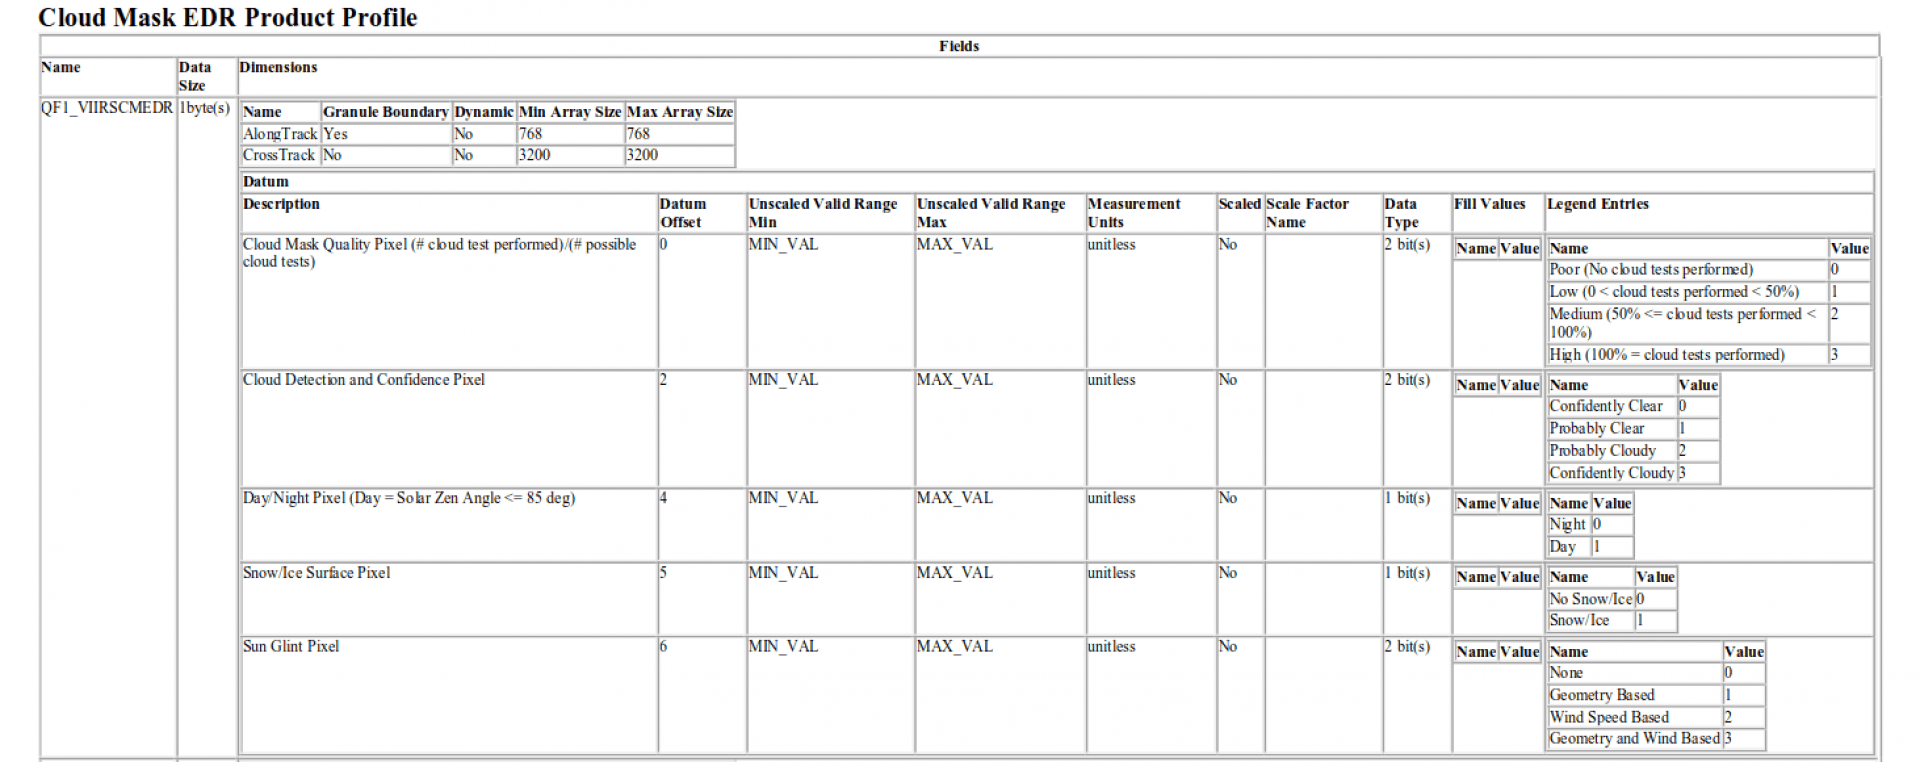
For example, the image below shows the preview image in the Region tab of the Field Selector with a VIIRS-CM-EDR_All/QF1_SnowIce_Surface_Pixel image we loaded.
If you just click Create Display, the data will be displayed at a reduced resolution. For example, if I do that and then zoom into a region of interest I get the following:
To get the full resolution of the data, you can hold down the Shift key and do Left-Click+Drag in the Region tab (completely within the bounds of the data). Everything within the green box you draw will be displayed at full resolution. For example, I opened a new tab then followed that procedure to draw a green box containing all of the data. After clicking Create Display I zoomed into that same region of interest to get the following (which displays many more points because it was done at full resolution):
If you try the above procedure and are not getting the results you want, can you please post the file to our anonymous ftp site? Here are instructions for doing that:
ftp ftp.ssec.wisc.eduuser:
anonymouspassword:
your_email_addressbincd pub/incomingput filenamebyeOnce you post the data, please let us know the filename and we'll pick it up. Note that if you have the data (VICMO) and geolocation (GMODO) in separate files, please post both of them.
Thanks,
Barry

